1
Designer, 0 developers
One live store since 1 November 2026, for bakery and Thanksgiving deli orders.
José Ochoa · Product & web design · Data visualization
On 1 November 2026, a bakery ordering system I designed went live at Community Food Co-op, built by AI agents I directed and checked by 6,089 automated assertions. It sits on the co-op’s design system, which I keep in parity across theme.json, CSS and Figma so an agent can’t hardcode a value without it surfacing.
Figure 1 · Commits per day, all branches
Daily commits on the bakery plugin, 12 June to 5 November 2026, with milestones. October alone holds 1,174 of 1,503.
1
Designer, 0 developers
One live store since 1 November 2026, for bakery and Thanksgiving deli orders.
6,089
Automated assertions
In a full test run, with 1 known red that every report names.
1,594
Assumptions written down
Numbered A1 to A2121, each with a status: signed off, superseded or waiting on me.
94
Design tokens
1 source of truth, mirrored to Figma, with 0 unexplained deltas either way.
Selected work
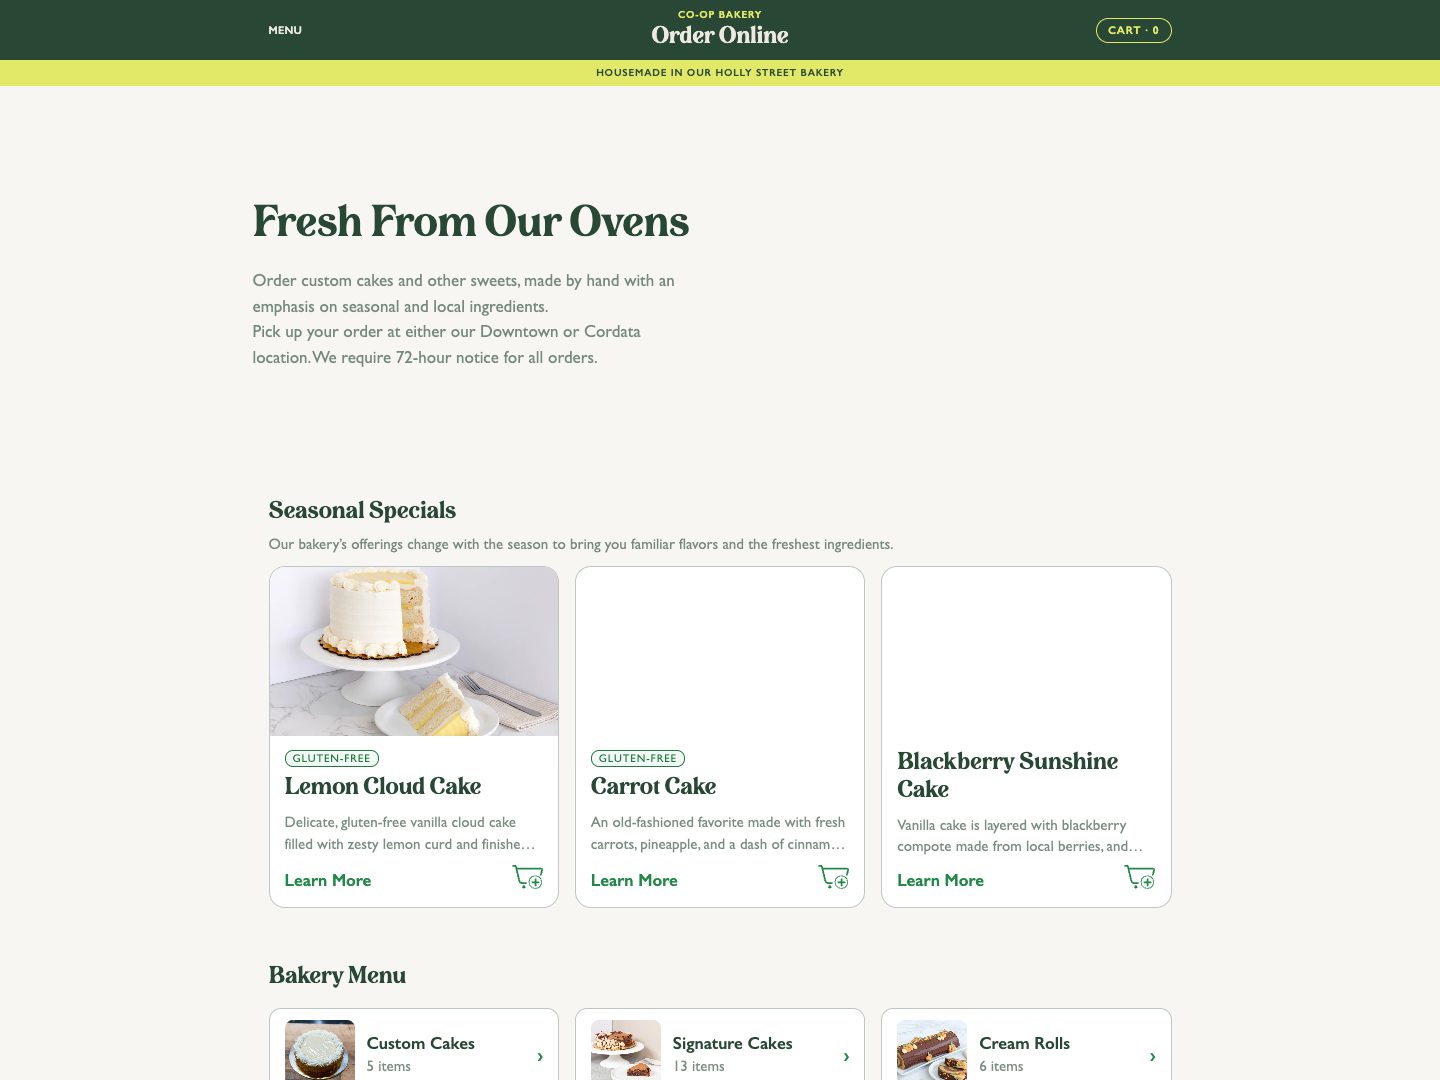
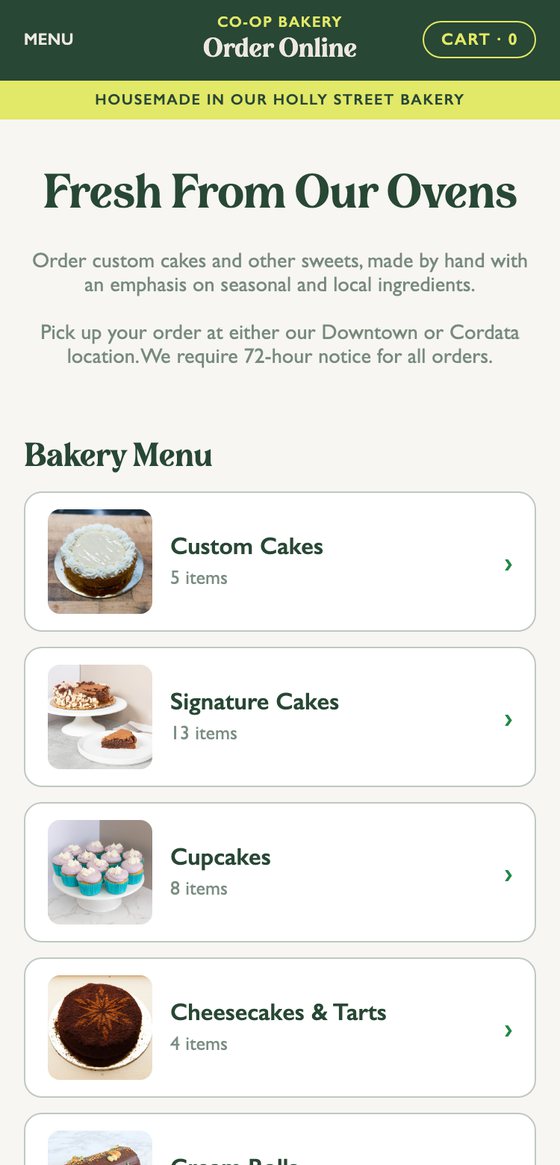
Case study · Community Food Co-op · 2026
A pickup-first cake builder, staff dashboards, printed tickets and a Thanksgiving deli layer.
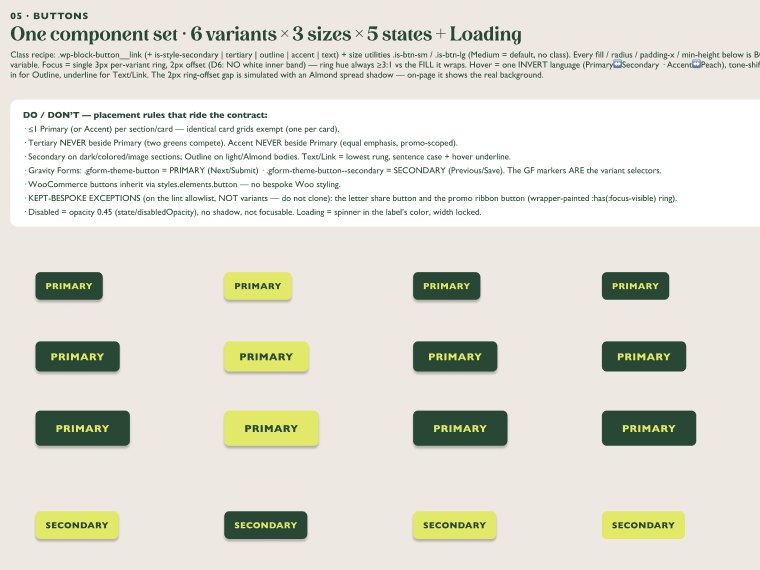
Case study · Design system · 2026
theme.json, CSS and Figma held in parity by a drift checker and a hook that stops agents hardcoding values.
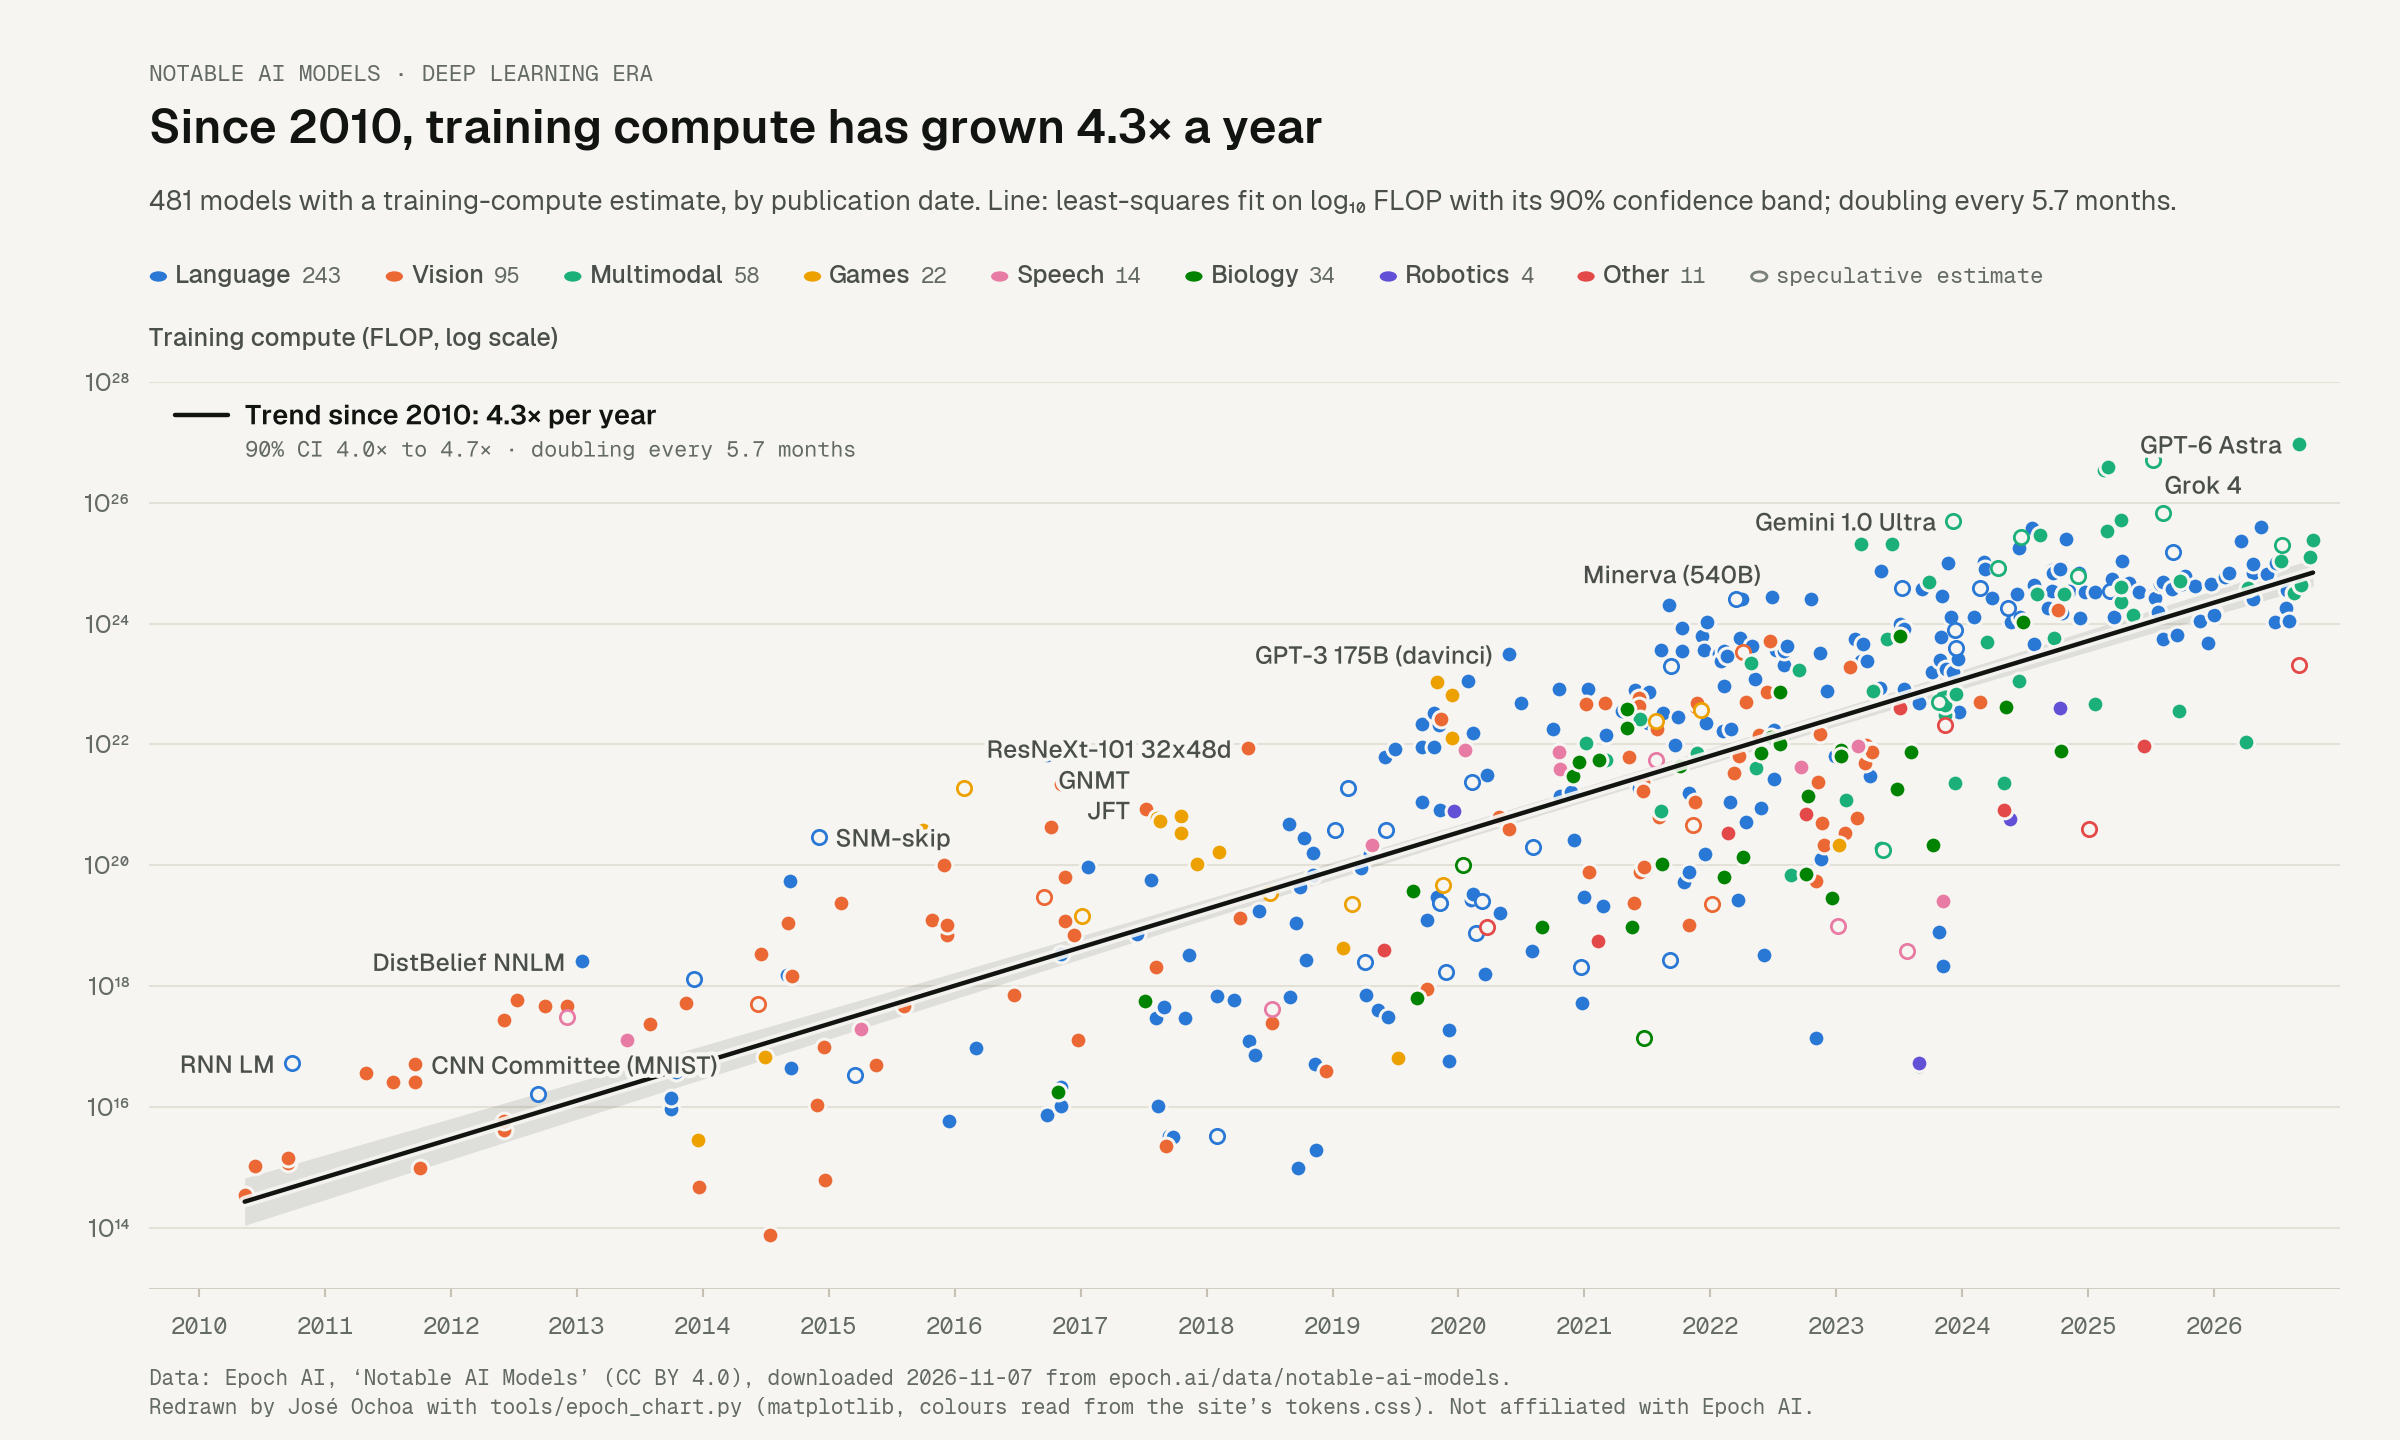
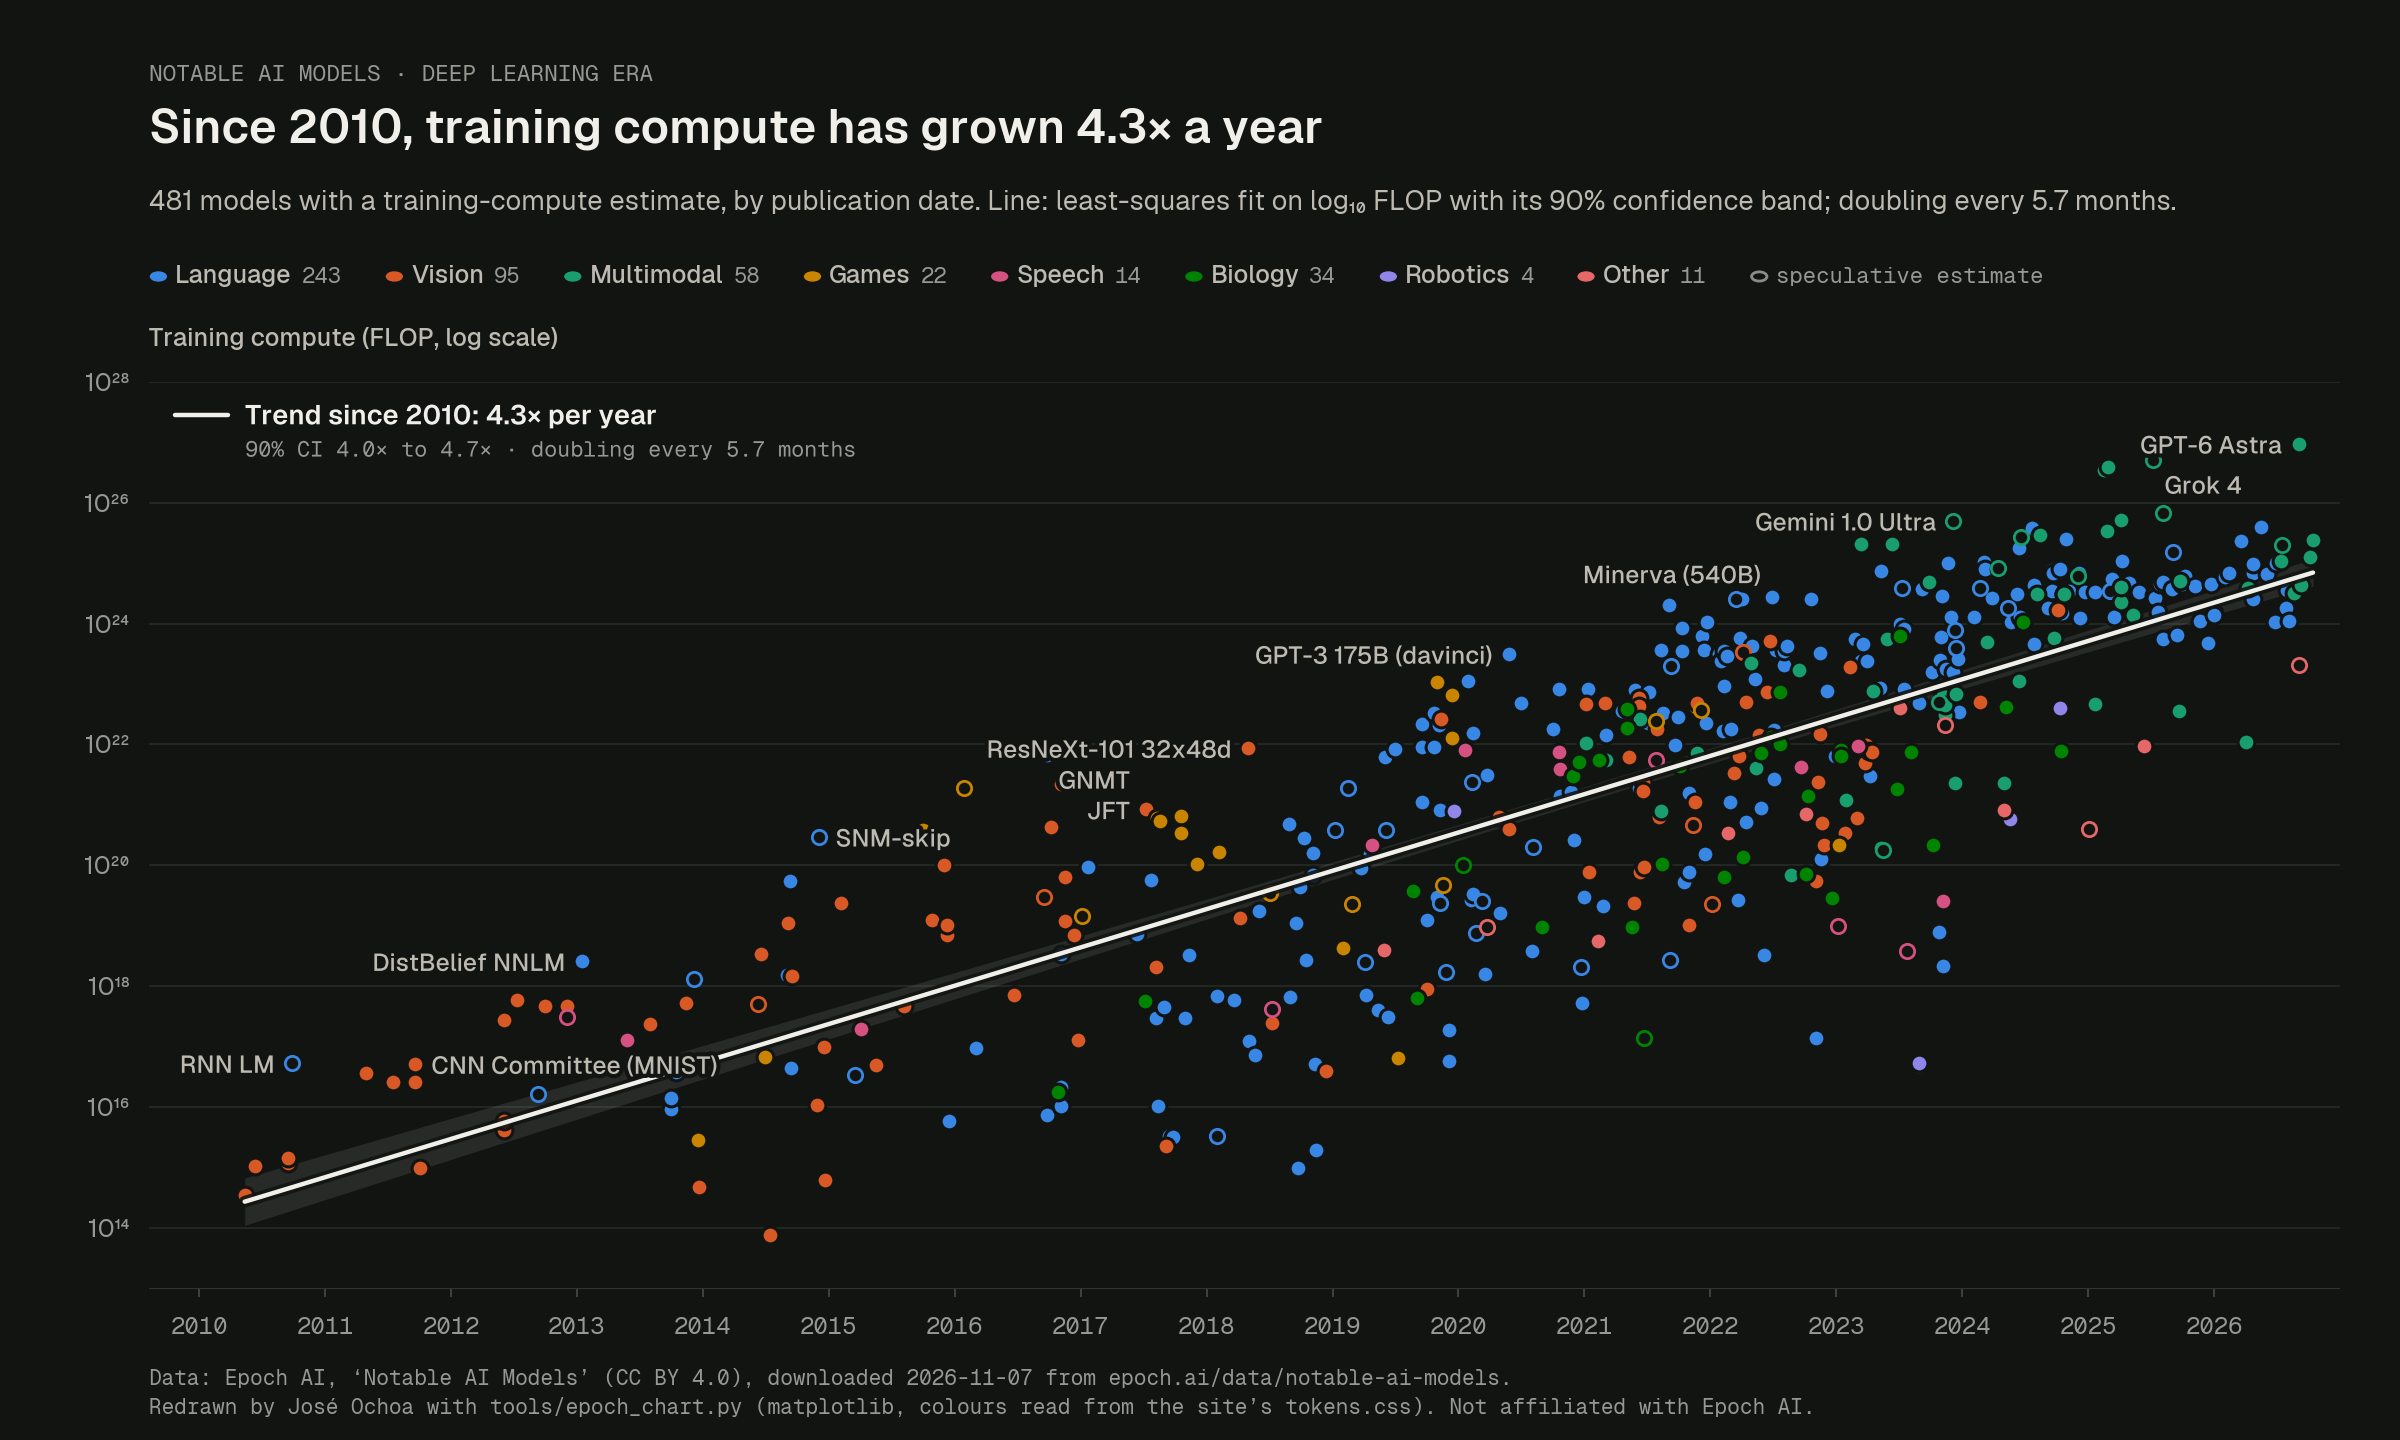
Study · Epoch AI data · 2026
Epoch’s CC-BY data rebuilt as a chart that reflows at 390 px instead of cropping.

A community map of tension nets in Bellingham, with location privacy built into the data model.

Figma system, site, form backend, QR flyers and a share card, live the day it was built.
How I work
I don’t write the code. I specify it, direct the agents that do, and prove it works.
Every open question gets decided one at a time, with a recommended answer. Anything an agent has to assume becomes a numbered row before it commits.
An orchestrator splits the work into lanes, each builder works on its own branch, and a fresh reviewer scores every risky change. Below 9/10, it goes back.
Test output and screenshots, never summaries. Then I walk staging on my phone, and production moves only on my word.